...
Open the WhiteSource home page.
From the menu bar, select Dashboards > Security Trends Dashboard. The Security Trends Dashboard is displayed.
...
This chart displays the number of security vulnerabilities over time for the selected context (organization, product, or project) per vulnerability severity. Expanded information on a charted data point can be displayed via a tooltip when hovering the mouse pointer over that data point, as demonstrated on the screenshot below.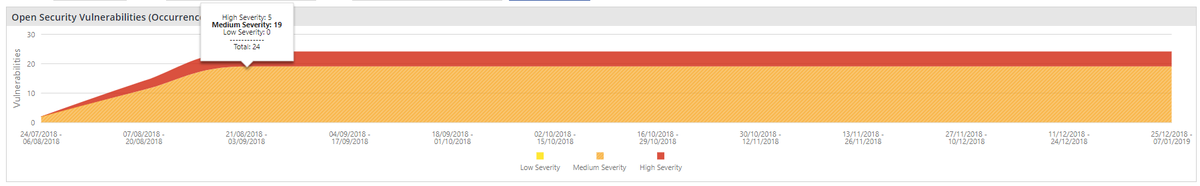
...
Average Remediation vs. Handling Time Chart
...
| Info |
|---|
You have the option to click on any chart in order to be forwarded to the relevant report with the same scope and interval settings as in the chart. |