...
This chart displays the number of security vulnerabilities over time for the selected context (organization, product, or project) per vulnerability severity. Expanded information on a charted data point can be displayed via a tooltip when hovering the mouse pointer over that data point, as demonstrated on the screenshot below.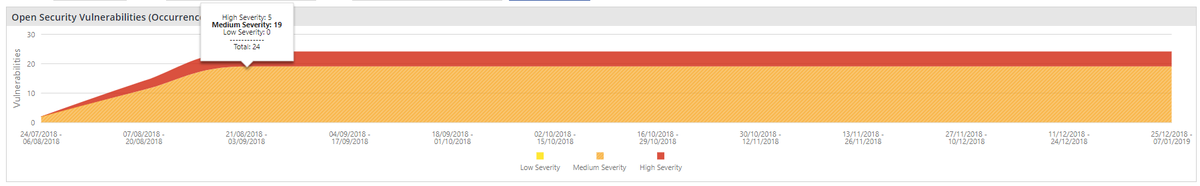
...
Average Remediation vs. Handling Time Chart
...